NFPA Offers Latest Hydraulics-and-Pneumatics Industry Trends Report
The National Fluid Power Association (NFPA) released its latest update for hydraulic- and pneumatic-industry trends. Data was collected from more than 80 fluid-power-product manufacturers by NFPA’s Confidential Shipment Statistics (CSS) program. The full report is available to NFPA members.
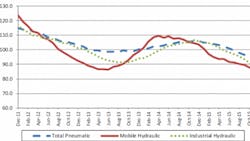
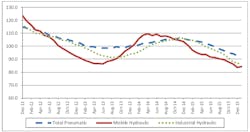
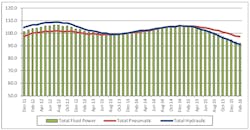
Here is a look at a few graphs and charts to outline the current trends and anticipated changes in hydraulic and pneumatic markets.
Pneumatic, Mobile, and Industrial Hydraulic Orders Index
Total – Hydraulic and Pneumatic Shipments
Shipments – Cumulative Year-to-Date % Change (2016 vs. 2015)
Overall, industry shipments of fluid-power products for February 2016 decreased 12.3% compared to February 2015, and increased 4.9% compared to last month. Mobile hydraulic, industrial hydraulic, and pneumatic shipments decreased in February 2016 compared to February 2015, and increased when compared to last month.
More information is available to NFPA members; contact NFPA at (414) 778â3344 for more information.
Eric Armstrong, overseer for the NFPA’s fluid-power economic and statistical programs, is the author of the original article, which can be viewed here on the NFPA website. Eric Armstrong can be contacted at [email protected] or (414) 778â3372.
About the Author

Leaders relevant to this article:


