What is Bulk Modulus, and When is it Important?
This file type includes high resolution graphics and schematics when applicable.
Most will agree that performance requirements for hydraulic control systems are becoming increasingly more stringent. One of the functional properties of fluids that designers frequently overlook is its compressibility or, as it is more often called, its bulk modulus. Many laboratory tests have been conducted to measure the bulk modulii of various fluids because it can affect the performance of a system.
What is Bulk Modulus?
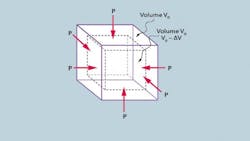
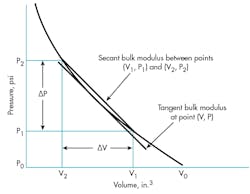
Most substances diminish in volume when exposed to a uniform, externally applied pressure. A typical plot of volume vs. pressure is shown in Figure 1. The curve shows that:
V = f (P,V0, k)
where: k = compressibility (usually negative), in.2/lb
P = pressure, psi
V0 = initial volume, in.3
The term bulk modulus usually means the reciprocal of compressibility and defines the slope of the curve in Figure 1. A steep slope signifies a stiff, only slightly compressible fluid — one with a high bulk modulus. A flat slope signifies a fairly compressible fluid — one with a low bulk modulus.
Defining Bulk Modulus
Because the plot in Figure 1 is not a straight line, the slope changes from point to point. There are two common ways of defining the slope or bulk modulus:
• True or tangent bulk modulus at a point. Placing a straight edge tangent to the curve at a specific point yields the tangent bulk modulus. It is written (as a derivative) as:
Br = dPV/dV.
• Average or secant bulk modulus is the slope of a line between any two points of the curve. That is:
Bs = (P2 – P1)V0/(V1-V2), or Bs = ∆PV0/∆V.
Because a line drawn between any two points appears as a chord of an arc, it is a secant, hence, the name secant bulk modulus.
Before giving some typical values of fluid bulk modulii, we must take one more variable into consideration: temperature.
Temperature and Bulk Modulus
• compress the fluid very slowly so that heat generated can dissipate. This is called isothermal (constant temperature) bulk modulus.
• compress the fluid rapidly and measure the pressure even though it results from both compression and thermal expansion. This is called adiabatic (no beat lost) bulk modulus. Most hydraulic applications are described by the latter. Therefore, most of the bulk modulii discussed in this article are adiabatic. Table 1 shows some typical values for various fluids.
After comparing the values of bulk moduli in Table 2 for high temperature to those for room temperature, the importance of keeping fluid temperature as low as possible is readily seen.
Predicting bulk modulus of air-liquid mixtures
The values in Table 2 are the effective bulk modulus for several air-oil mixtures. These were determined by test, as described below. Using these test results, a convenient empirical equation was developed to predict (without tests) the effective bulk modulii of other air-oil mixtures:
1/Be = 1/B + Va / (Vt × Ba)
where: Be is the effective bulk modulus
B is the bulk modulus of the fluid
Va is the volume of air
Vt is the volume of air-fluid volume
Ba is the bulk modulus of air
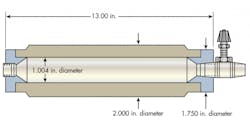
A thick walled, stainless steel welded cylinder with pipe thread ports was connected to long-engagement needle valves having small-area nylon seats, Figure 2. The cylinder was pressurized with a hand pump. The pressurized fluid was then allowed to expand rapidly into a precision glass manometer tube. The manometer measured the amount of fluid required to pressurize the cylinder.
While pressurized, the cylinder was measured to determine its radial and longitudinal deflection at various pressures. Strength-of-material equations (Timoshenko's) were then used to determine internal deflections, thus obtaining tare values of volume — which were subtracted from respective manometer readings. Air-oil mixtures with entrained or entrapped air from 0.125% to 1.57% were measured. In addition, fluid with no entrained or entrapped air was measured. The dissolved air content of the air-oil mixtures (which has no effect on bulk modulus values) was kept below 2%.
Effect of Air on Bulk Modulus
Designers should be cautious before using published bulk modulus values. The values usually are determined by laboratory methods, which take special precautions to de-gas the fluid before it is trapped and compressed.
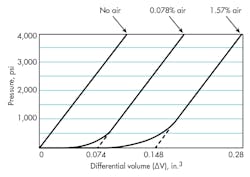
To illustrate the variations that can occur, we measured adiabatic volume changes versus pressure in a thick walled, stainless steel cylinder, Figure 2. Both degassed and aerated fluids were used. Figure 3 illustrates the curves that resulted. They indicate that a trapped quantity of air will offset the curves by a value about equal to the volume of air present.
As might be deduced intuitively, the straight-line part of the curves does not begin until the air volume entrained in the fluid is compressed. Once the air is compressed, the slope of all the curves is the same. If measured from 0 psig, it can be seen that adiabatic (secant) bulk modulus values will differ considerably with varying air content. This is seen in the values for adiabatic bulk modules in Table 2. (The test values observed were adjusted for differential volumes resulting from cylinder expansion, then values of bulk modulii were computed.)
Volume Lost in Pumps and Actuators
The output of a pump, or the positional relationship of master and slave actuators, varies with
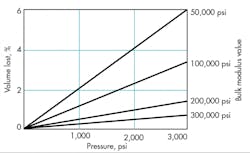
the bulk modulus of the fluid used. Figure 4 illustrates the percentage volume lost vs. pressure and bulk modulus. In the case of a pump, the percentage volume loss in the output is seen as loss of horsepower. For master-slave actuators, the volume loss is seen as loss of stroke of the slave.
The equation used in preparing Figure 4 is:
∆V/V0 × 100% = 100 × P/ B
Stopping a Moving Load
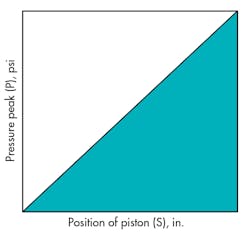
If a cylinder moves a load at a uniform velocity, (constant flow to the cylinder), the load has momentum that must be absorbed by the fluid and the system when a valve flow suddenly closes. If the valve is located downstream, fluid pressure will rise from some nominal value to some peak pressure as energy is absorbed, Figure 5. Assuming rigid cylinder and lines and a linear rise in pressure, the fluid's bulk modulus will determine peak pressure. The area under the curve, when multiplied by ram area represents work:
W = F × S
W = ½ ( P × A) × ∆s
The work done (energy absorbed) equals the kinetic energy, EK, of the moving load, that is:
W = EK = (½ W/g) × v2
Where W = work
F = force applied to the load
s = distance traveled
EK = kinetic energy
g = gravity constant
To convert work from in.-lb to ft-lb:
Work (ft-lb) = 1/24 P (psi) × A × ∆s
Because A × ∆s = ∆V = ∆P × V0/B, then EK = (∆P)2 × V0 /24B.
Where V0 = volume trapped in actuator and lines.
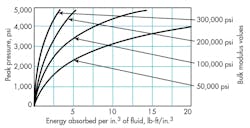
Figure 6 illustrates peak pressure versus energy (ft-lb) per in.3 of fluid for various bulk modulii. It can be seen that for a specific maximum pressure, the stiffer the fluid, the less energy absorbed and the less overshoot. Increasing actuator volume increases its energy absorption and its overshoot.
Fast load reversals
Because most fluids are compressible, the fluid in an actuator must first be compressed before a cylinder’s piston will move a load. In other words, an amount of fluid equal to the compressed volume must be added to an actuator before any useful work can be done. Because this process does not do useful work, it is lost work,
Where: ∆P+ = pressure increase
AP = piston area
si = increment of stroke
Therefore: WL = ∆P × ∆V
But ∆V = ∆P × V0/B, so: WL = ∆P2 × B × V0
To obtain lost power, divide by time, t:
WL = ∆P2 × V0 /(B × t × 6600)
Because power becomes significant in higher pressure ranges, let us examine a typical 3000-psig system, that is, ∆P = 3000 psi.
PL = 1363 V0/(B × t)
Where: PL = lost horsepower, hp
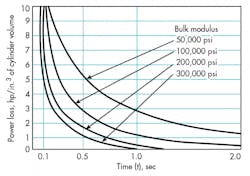
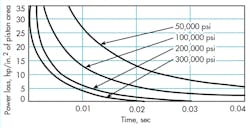
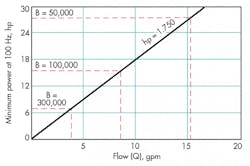
Figure 7 shows a plot of lost power versus time for 1 in.3 of actuator volume for various bulk modulii. Power loss increases with actuator size, and response time decreases. Figure 8 illustrates lost power versus response rate for various bulk modulii.
The loss in power may look relatively small until we consider an average actuator. If we assume a bulk modulus of 200,000 psi, a response rate of 100 Hz, and a stroke of 10 in., the loss is 6.75 hp per in.2 of ram area. Figure 9 relates power loss to total system power available. For example, a 3000-psi, 3.8-gpm system that can supply 6.75 hp cannot move a load at 100 Hz with a 1-in.2-ram because all the power would be used for compressing the fluid.
Resonance of Hydraulic Systems
The natural frequency of a spring-mass combination is:
f = (1/2π) (kg/W)1/2
Where: f = frequency, Hz
W = weight, lb
k = spring rate, lb/in.
To equate this to a hydraulic system, we need only substitute bulk modulus for spring rate. Thus, a low modulus also lowers the natural frequency of a system. For example, if 1% air content changes the bulk modulus of a fluid by 50%, its natural frequency decreases by 30%. This greatly reduces the stability of the system.
Why Bulk Modulus is Important
From the preceding discussion, it should be clear that the absolute value of the bulk modulus of a fluid seriously affects system performance in relation to position, power level, response time, and stability.
Two factors that figure prominently in the control of bulk modulus are fluid temperature and entrained air content. For example, Table 2 shows that raising the temperature of Brayco 745 hydraulic fluid by 100° F alone reduces its bulk modulus to 61% of its room-temperature value. Table 2 also indicates that introducing 1% air by volume reduces the bulk modulus to 55% of its room-temperature value. If these two conditions occur simultaneously, the net effect is to reduce the bulk modulus by 67%.
In summary, in view of today's requirements for increased horsepower and response time, it behooves a designer to pay more attention to bulk modulus than ever before.
Vince Magorien is vice president of engineering, Seaton-Wilson, Inc., subsidiary of Systron-Donner Corp., Burbank, Calif. This article was originally published in the November 1969 issue of Hydraulics & Pneumatics magazine. It is reprinted here for its timeless and in-depth explanation of bulk modulus and its continuing relevance.
About the Author
Vincent G. Magorien
Seaton-Wilson

Leaders relevant to this article:
