Pinpoint power-loss problems
Fluid power technology emphasizes the use of efficiencies as key figures of merit for many products across multiple marketplace segments. Such reasoning is sound, especially with the push to reduce energy consumption. However, efficiency is too simplistic a measure, and dare say, tends to be rather abused.
First, efficiency often is implied as “constant throughout the operating range of the machine in question, such as a pump, motor, or cylinder.” Second, the quoted value is usually the peak value that’s achievable by the machine. This is simply not a valid use of known efficiency values.
Industry applies well-known efficiencies to pumps and motors, namely volumetric efficiency (ηV) and mechanical efficiency (Hm). Both are calculated as ratios of ideal to actual flow and torque, or vice versa.
They are somewhat artificial and depend on knowledge of the machine’s displacement, which doesn’t conveniently yield to direct measurement. Instead, it requires some judicious assumptions or total reliance on empirical methods. This doesn’t minimize their value, though, as both of these artifices are employed in pump and motor development.
Overall efficiency (ηO) is the ratio of actual delivered output power to total input power. This “real” efficiency can be determined by means of objective measurements.
It is common knowledge that efficiencies are not constant, but, rather, vary with current operating conditions (e.g., pressure, flow, load torque, speed, etc.) from near zero to values that approach near 100%. As a result, they require interpretation.
Lost Power Method
A better method for assessing losses accrued in rotating machinery is the lost powerconcept. For each machine and each component, suitable mathematical models that use measured input and output power can calculate the amount of power lost (Wlost) to friction and internal leakage. Like efficiency, it’s simple in principle:
Wlost= Win– Wout
Lost power’s main advantage is that actual power levels are retained in any desired system of units. Efficiency is always relative, considering that it’s a dimensionless ratio. The lost power, like efficiency, varies with the operating conditions, such as pressure, speed, and load. However, because actual units of power are retained, the lost-power curve for a machine helps determine the total energy lost during, say, a normal operating shift or any desired time interval.
Two key sets of data are required to make concrete evaluations of total lost energy in a given application. First, a lost-power diagram for the machine can be based on suitable mathematical models, or alternatively, taken directly from measured input and output powers. Second, a histogram typifies the machine’s operating cycle, which requires on-board data acquisition and sampling computers as well as appropriate transducers. The case studied in this article required a rotational speed-sensing device.
Simultaneous use of the lost-power curve and operational histogram can evaluate the relative merits of a machine and its application in terms of lost energy. The methods are simple in concept and don’t require advanced mathematical methods. However, like all empirical processes, it may need lots of data manipulation. That’s why, in this scenario, a computer becomes indispensable.
HST Case Study
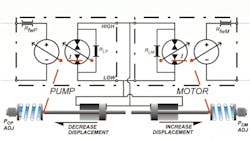
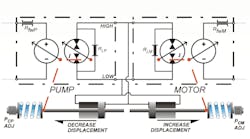
The example machine used for this study is a hydrostatic transmission (HST) with a pressure-compensated pump and motor, Figure 1. The compensators—simple pressure-area/spring-force mechanical devices—were designed and adjusted so that the motor compensator activates at a lower pressure. Then, when it reaches a pressure that causes the motor to go to full displacement, the pump compensator becomes active. It’s referred to as “sequential compensation,” because one compensator activates immediately after saturation of the other.
This configuration results in a motor speed-torque characteristic known as a constant output power drive. The aim of such a transmission and compensation method is to prevent prime mover lugging.
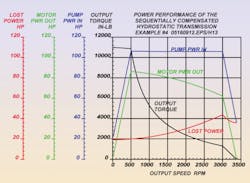
A series of graphs helps illustrate the power performance of the transmission under study, Figure 2. These curves aren’t vital to the current analysis, but do offer some insight into the nature of the doubly compensated transmission. In this case, it’s clear that output power is not constant, while input power shows the opposite. Also, the lost power can be seen to be nothing more than the input power minus the output power. Only the lost power curve is important to the following discussion.
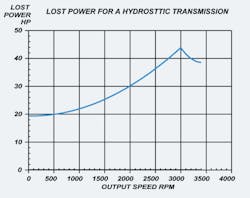
The lost-power diagram gives clues as to how the application may be adjusted in order to get more useful work done for fewer dollars, Figure 3. Typically, lost power for continuous rotational pumps and motors, as well as transmissions, is low at low output speeds and increases with speed.
Some other key points are that all four individual efficiencies (two volumetric and two mechanical) were set to 97%. Also, the pump was operated by a speed-regulated prime mover that maintains a constant 1800 rpm. Peak input power was 102 hp.
Similar to what was stated above, this transmission’s losses are lowest when operating is low speed, which is also the region of high pressure, and they increase exponentially with increasing speed. This is usually indicative of a machine that is heavy in mechanical (frictional) losses , but “tight” in terms of volumetric losses. And yet, the instant model has all four individual rated efficiencies set to 97%.
Therefore, it begs the question: “How can this speed-dependent rise in losses be possible?” It is an interesting question, and is worthy of further investigation, but it will not be undertaken here.
Lost Power Vs. Efficiency
Lost power in the hydrostatic transmission is the sum total of power losses that support internal leakages and internal frictions. It’s better than conventional efficiency for measuring the efficacy of converting prime-mover power into useful variable output shaft power. That’s because lost power measures energy flowing out of the heat exchanger and potentially helps save money otherwise allocated for what amounts to wasted fuel. Efficiency is merely the percent of power at a given operating point, that makes its way to the load.


