Expansion of the null zone
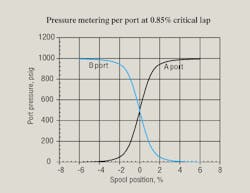
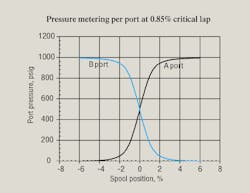
To see the null zone of a valve clearly, a simulation was run for a range of ±6% of spool shift. Performance parameters from previous simulation runs were not changed, so Figure 1 and several that follow show a magnified look at the null zone.
Figure 1 gives a detailed look at pressure metering because it covers such a small amount of spool shift. Again, it confirms the rule of thumb that pressure metering is confined to the overlap (0.85% in this case) plus about 5% of spool travel.
The two port curves crossing exactly at zero spool shift show that this valve is perfectly nulled. The laps on all the lands being identical is indicated by the two port curves crossing at exactly 500 psi. Later, the consequences of asymmetrical and imperfect flow grinding will be simulated by setting the overlaps on the individual lands to unequal values. But for now, the null performance of this valve is very good, albeit simulated.
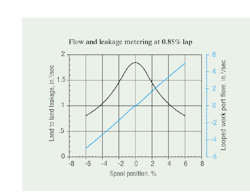
Flow metering and land-to-land leakage in Figure 2 are shown in expanded form around valve null. Here, the peak leakage is about 1.85 in.3/sec, compared to the inputted target of 2.75 in.3/sec. Perhaps more important, though, is that a slight amount of non-straightness occurs in the flow metering curve between about ±1% around zero. This is a consequence of the transition from the hyperbolic function to the straight line function. In other words, if perfectly constant flow gain is required through the null zone, it is not likely with this model.
However, the amount of non-linearity is so slight that it will have no effect on the valve’s performance in any application. This is true whether the application is simulated or from a real valve. The slight waviness will be imperceptible in the application.
Comparing simulation to reality
Real valves are likely to have some “lumps and bumps” if they are examined with the intensity, magnification, and total lack of instrumentation error that is possible with this simulation. That is, the irregularity in the simulation is probably less than the noise that would be expected in any electronic data acquisition system. The question remains, however, “Can any real flow grinding process produce a null flow metering that is straighter than that of the simulation?” No answer exists at this time.
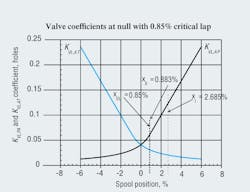
A better view of the valve coefficient can be seen when it, too, is subjected to expansion of the null zone as depicted in Figure 3. Here, the curvature and the gradualness are noticeable, however, the mathematical coincidence of both the values and the slopes at the transition point makes for a smooth characteristic.
This graph has three key parameter values included and identified with the vertical dashed lines. The values are xX, xOL and xI. Here is a bit of review: The first is the transition point, xX, which is where the hyperbola and straight line come together. The second, xOL, lies almost on top of the first because the two are very close in value. The third, xI, is that point where the hyperbolic function would go to infinity if it were allowed to. The computer program has been coded so that to the left of the transition point, the hyperbola is used, but at and to the right of the transition point, the straight line is used. Thus, the program uses only the KV values that correspond to the composite curves shown here.
Effects of changing overlap
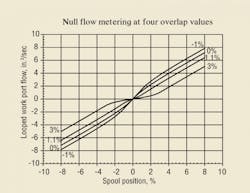
Instead of having just one overlap for all four valve lands, four different overlaps can be modeled. The four different overlaps are 3%, 1.1%, 0% and –1%. Of course, the –1% value is normally referred to as an underlay condition. One way of looking at the results is that we are simulating the effects of progressive flow grinding steps, starting with a spool blank that has 3% overlap, testing for flow, pressure, and leakage metering. We would then grind off a bit more material from the lands to get to 1.1% overlap, test again, and so on, through 0% and -1% overlap values.
The results will closely approximate the values that can be expected from a real valve, except that in the simulation, each land will be given exactly the same amount of lap as all other lands. This is a practical impossibility in any flow grinding process on a real valve. However, it easily succumbs to the magic of modeling and simulation.
Flow metering results
Valve manufacturers are eager to show off the flow metering curves of their valves because they are thought to be the most important characteristic. Their point is arguable and will be accepted as true in the interest of harmonious simulations.
Figure 4 shows results of the four different amounts of overlap applied to the same valve. It shows the very typical and expected results if we were to flow grind a servovalve in the manner simulated. With 3% overlap, a flow gain reduction is seen at the zero-crossing point. This is expected. But more importantly, the flow gain does not go to zero, there is no flow shut off, and there is no real dead zone.
Flow metering takes place over the entire overlap range, albeit at reduced gain. This is how real valves behave, and it is the reason that ISO 5598 defines a servovalve as a valve with less than 3% center overlap. It is also the reason why some valve manufacturers state that their “zero-lapped valve” will have a region of reduced flow gain that is not less than 25% of the flow gain just outside the null zone. This is not, necessarily, a disqualifying factor because most applications will not be adversely affected by the slight overlap and its accompanying flow gain reduction.
An evaluation of the flow gain at the zero-crossing in Figure 4 reveals that there is very close to a 25% reduction in gain relative to that measured between 6% and 8% of spool travel. However, because of difficulties in interpreting data, competent people will not all arrive at 25%. The working group responsible for ISO 10770-1 refused to take up the methods for assessing and reporting the amount of overlap.
At the other overlap extreme, that is, at –1%, flow gain increases at the origin. Again, this is totally expected and closely mimics the actions of a real valve that is under lapped. It is well known, and has been widely reported. In fact, the flow gain doubles at the origin when an under lap exists, and the spool travel range over which gain doubling occurs follows the amount of underlap.
The phenomenon is realizable in even the most rudimentary valve models. The price paid for under lapping a valve is increased land-to-land leakage. For the 0% overlap case, an increase in flow gain occurs at the origin. Not surprisingly, though, it does not extend very far beyond the zero crossing.
At 1.1% overlap, the flow gain is slightly decreased at null, which tells us that critical gain is somewhere between 0% (slightly under lapped) and 1.1% (slightly overlapped). It was shown in the previous simulation run that 0.85% overlap resulted in flow metering that was critically lapped. This is quite typical, with the rule of thumb being that a physical overlap of about 0.5% to 1% is required to achieve flow metering with the least gain change at the zero-crossing.
Handbook serves electrohydraulic system designers
The newly published fourth edition of the Designers’ Handbook for Electrohydraulic Servo and Proportional Systems contains even more useful information than its predecessor, the highly successful third edition, which has become the defacto Bible for electrohydraulics technology.
Now you can learn even more about electrohydraulic systems and their design, including:
• how to calculate and control pressure losses in plumbing, subplates, and manifolds,
• how to analyze and control a variety of mechanical loads, including conveyors and belts and triangulated loads,
• valve dynamic properties and how to include them in your system,
• electronics, especially transducers and signal conditioning, and
• mobile equipment electrical systems, including batteries and charging systems.
There is no limit as to how electrohydraulics is going to revolutionize our industry, so order your copy to secure your career in this dynamic technology. And if certification in electrohydraulics is your goal, the fourth edition of the Designers’ Handbook is essential to your preparation. Don’t risk being left behind in a world where the only constant is rapid change.
To order, visit our Bookstore. Print the PDF order form, fill it out, and mail, fax, or e-mail it to us.
